Spectroscopy
MR spectroscopy
The technique of MR spectroscopy (Magnetic Resonance Spectroscopy, MRS) is used both in clinical practice and for research purposes. It is a non-invasive method by which we can obtain information about the chemical composition of the observed tissue. The most widespread MR spectroscopy is the so-called proton (1H), where we focus on tissues containing hydrogen, most often the brain, liver, prostate. To a lesser extent, tissues containing phosphorus (31P) are measured, eg muscles, brain. It is relatively rare to measure metabolites containing 13C and 19F.
The history of MR spectroscopy dates back to the 1930s. Nuclear magnetic resonance (NMR) was first described and measured in 1938 by Isidore Rabi, for whom he won the Nobel Prize. His work was followed by Edward Purcell (1945), who detected NMR absorption in paraffin, and Felix Bloch (1945), who found NMR absorption in water signal. Both gentlemen won the Nobel Prize for their discoveries. The NMR method has found wide application in biochemical laboratories. Technological development took place in the 1980s, which enabled the first in vivo spectroscopic measurements on humans.
The basic principle of MR spectroscopy is based on the so-called chemical shift of tissue. The chemical shift describes small differences in the resonant frequency of otherwise identical nuclei located in different molecules and different molecular environments. Thus, the exact frequency of each nucleus depends on both the particular molecule where the nucleus is located and its specific position on that molecule. Chemical shifts can provide important information about the molecular composition of the measured tissue and form the basis of MR spectroscopy (MRS).
In proton MR spectroscopy, the strongest signal is the water signal. It is about 10,000 times stronger than the signals of the metabolites we are targeting. For measuring quality data, it is therefore essential to be able to suppress the water signal appropriately. Often, the water signal is used as a reference value, which in turn allows absolute quantification of the concentration of metabolites in the tissue.
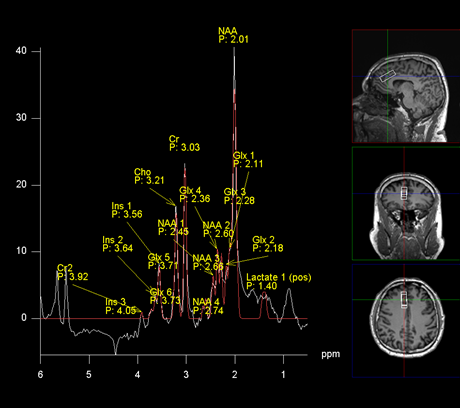
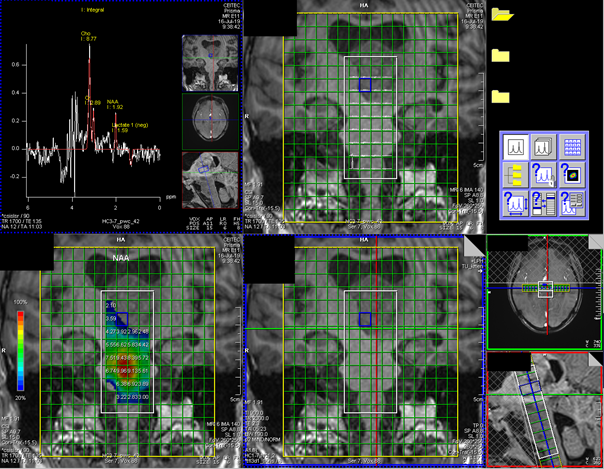
MR Spectroscopy can be divided into two basic techniques: Single Voxel Spectroscopy (SVS) and Chemical Shift Imaging (CSI, sometimes also Multi Voxel Spectroscopy), cf. Fig. 1. With the SVS MRS technique, we measure only one voxel (one spatial point). We measure the matrix of points using the CSI technique. Each technique has certain advantages and disadvantages, and their choice depends on the needs of a particular examination/study.
A more comprehensive description of the principle of MR Spectroscopy, as well as a more detailed division of the individual methods, is well described on the website mriquestions.com here.
Examples of the use of MR spectroscopy in our laboratory:
- Collaboration with scientists from the neuroscience program CEITEC MU: MRS 1H SVS brain.
- Cooperation with the Department of Urology, University Hospital Brno: MRS 1H SVS prostate.
- Cooperation with the Department of Neurology, University Hospital Brno: MRS 1H SVS of the spinal cord.
- Collaboration with pediatric neurology, Brno University Hospital: MRS 1H CSI brain stem.
- Collaboration with the psychiatric clinic of the University Hospital Brno: MRS 31P CSI brain.
Stručné srovnání SVS a CSI techniky:
| SVS | CSI | |
Nastavení měření | Poměrně rychlé, snadné | Pomalejší, náročnější |
| Nastavení homogenity pole (tzv. shimmování) | Malá oblast – většinou dobrý shimming | Větší oblast – může být problematické nastavení kvalitního shimmingu |
| Kvalita spekter | Velmi dobrý poměr signál/šum (SNR) | Nižší poměr SNR, mohou být problémy s kvantifikací |
| Kontaminace signálu | Kontaminace signálu ze sousedních tkání v důsledku účinků částečného objemu a posunutí chemického posunu | Kontaminace spekter ze sousedních voxelů v důsledku chemického posunu aliasingu |
| Čas měření | Poměrně rychlé. Cca 5min./voxel | Pomalejší. Čas záleží na velikosti měřené matice. Cca 20min. |
| Oblast měření | Voxel o velikosti zpravidla 6-12cm3 (např. 20x20x20mm = 8cm3) | Voxel o podobné velikosti jako SVS. Ovšem v měřené matici více voxelů (např. 8x8 voxelů) |
| Využití | Příklad klinická aplikace: středně velké homogenní léze ve velkých orgánech. Využití ve výzkumu: pokud známe přesnou oblast zájmu. | Příklad klinické aplikace: léze v malých orgánech nebo nehomogenní léze ve velkých orgánech. Využití ve výzkumu: zkoumání metabolických změn ve větších oblastech nebo ve větším počtu malých oblastí. |


