MRI principle
Introduction
Although we have classified functional magnetic resonance into two types (perfusion and BOLD), we use an MR tomograph for both and therefore the same basic principles. Magnetic resonance imaging (MRI) uses a physical phenomenon called nuclear magnetic resonance (NMR), which has been described in the literature since 1940 (Bloch 1940, Purcell 1946). From the beginning, applications appeared mainly in chemistry using MR spectroscopy (MRS). NMR imaging appears after 1970, and for better public acceptance, the word nuclear (or nuclear) has been deleted from the title and MRI has been adopted. The basic description of MRI is given here only briefly, as it is a very extensive issue.
The physical principle of NMR
The magnetic resonance phenomenon is based on the interaction of the nuclei of atoms having a magnetic moment with an external magnetic field. The nuclei of many atoms with a nuclear spin (eg 1H, 13C, 31P) behave as magnetic dipoles and can be either in a high-energy state (oriented against an external magnetic field) or a low-energy state (oriented in the direction of an external magnetic field). The transition between these two states is accompanied by the absorption or radiation of energy in the radio frequency band. The frequency of energy emitted by excited nuclei is directly proportional to the intensity of the external magnetic field. The exact relationship between the resonant frequency and the external magnetic field depends on the type of resonant nucleus (derived from different chemical elements), making it possible to independently detect different atomic nuclei in MRI. Furthermore, the resonant frequency is modulated by small "shielding" effects of electrons orbiting the nuclei (the electron carries an electric charge and because it moves, it creates a magnetic field around it that modulates the external magnetic field). These small differences (of the order of ppm) of the resonant frequency of protons in different molecules are used for MR spectroscopy, on the contrary, they are ignored by conventional applications of MRI and fMRI.
Hydrogen 1H, which makes up almost two-thirds of all atoms in the human body, is of paramount importance for medical imaging. From now on, we will use hydrogen nuclei (protons) for further description.
Under normal circumstances (without the action of an external magnetic field), the orientation of the rotational axes of the individual protons is completely random. Externally, the tissue as a whole does not show any magnetic properties. After exposure to a strong external magnetic field, two major changes occur:
- The magnetic moments (axes of rotation) are compared with the external magnetic field. The proton is then in one of two energetic (quantum) states. The vector of its magnetic moment can be oriented "parallel", i.e. in accordance with the direction of the external magnetic field (less energy-intensive state), or "antiparallel", i.e. opposite to this direction (more energy-intensive state). In the tissue volume selected by us, it will be possible to observe the resulting tissue magnetization vector M0, which is oriented in the same way as the external magnetic field and thus contributes to its slight amplification.

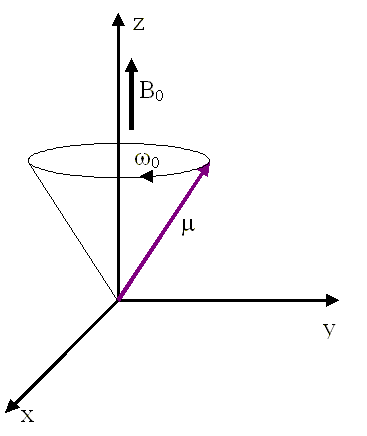
- Protons begin to perform another type of motion. In addition to "rotation" around their own axis, they also perform a so-called precessional movement, which can be imagined as a movement along the mantle of an imaginary cone.

The frequency of precessional motion (called the Larmor frequency) depends on the intensity of the external magnetic field and on the type of atomic nucleus, expressed by the gyromagnetic ratio

E.g. for hydrogen H1 the gyromatic ratio is = 42.58MHz / T (269.2T-1), ie in the field B0 = 1.5T the hydrogen nuclei will have a frequency of precession motion f0 = about 64MHz.
The direction of the magnetic moment of each individual preceded proton changes over time and the preceded protons move in different phases (tilted in different directions at a given time), thus canceling out their effect on the total vector of tissue magnetization in the x and y-axis planes.

The resulting tissue magnetization vector M0 thus has a direction identical to the direction of the external magnetic field B0. In order to "make it visible" and be able to measure it, we try to achieve its deflection from the direction of the z-axis to the XY plane (in this plane there is a detector - the receiving coil). This can be achieved by supplying energy in a suitable form, eg by electromagnetic pulses, also referred to as radiofrequency pulses (RF pulses).
Protons are not able to absorb energy from the whole electromagnetic spectrum radiation. In order for the energy of the electromagnetic pulse to be transmitted to the preceded proton, the Larmor frequency (angular frequency of the preceded proton) and the frequency of the electromagnetic pulse must be the same. The preceded protons thus resonate with an electromagnetic pulse at a given frequency (hence the name "magnetic resonance").
The supply of energy has a double effect on tissue protons:
- More protons can now be oriented antiparallel (higher energy intensity), which disturbs the balance established in the tissue volume by the external magnetic field. Thus, the size of the longitudinal component (in the z-axis direction) of the tissue magnetization M0 changes.

- The electromagnetic pulse (creates the external magnetic field B1) unifies the phase of all preceded protons, which leads to the formation of the transverse component of the tissue magnetization vector (this was so far zero).

The two events, of course, take place in parallel. The change in the tissue magnetization vector over time can then be displayed as follows:

For simplicity, we then consider the use of a new coordinate system whose z-axis coincides with the original and the x´, y´ axes rotate with the Larmor frequency around the z-axis. depends on the integral of the supplied energy (ie on the size of the RF pulse and its duration).
FID a relaxation
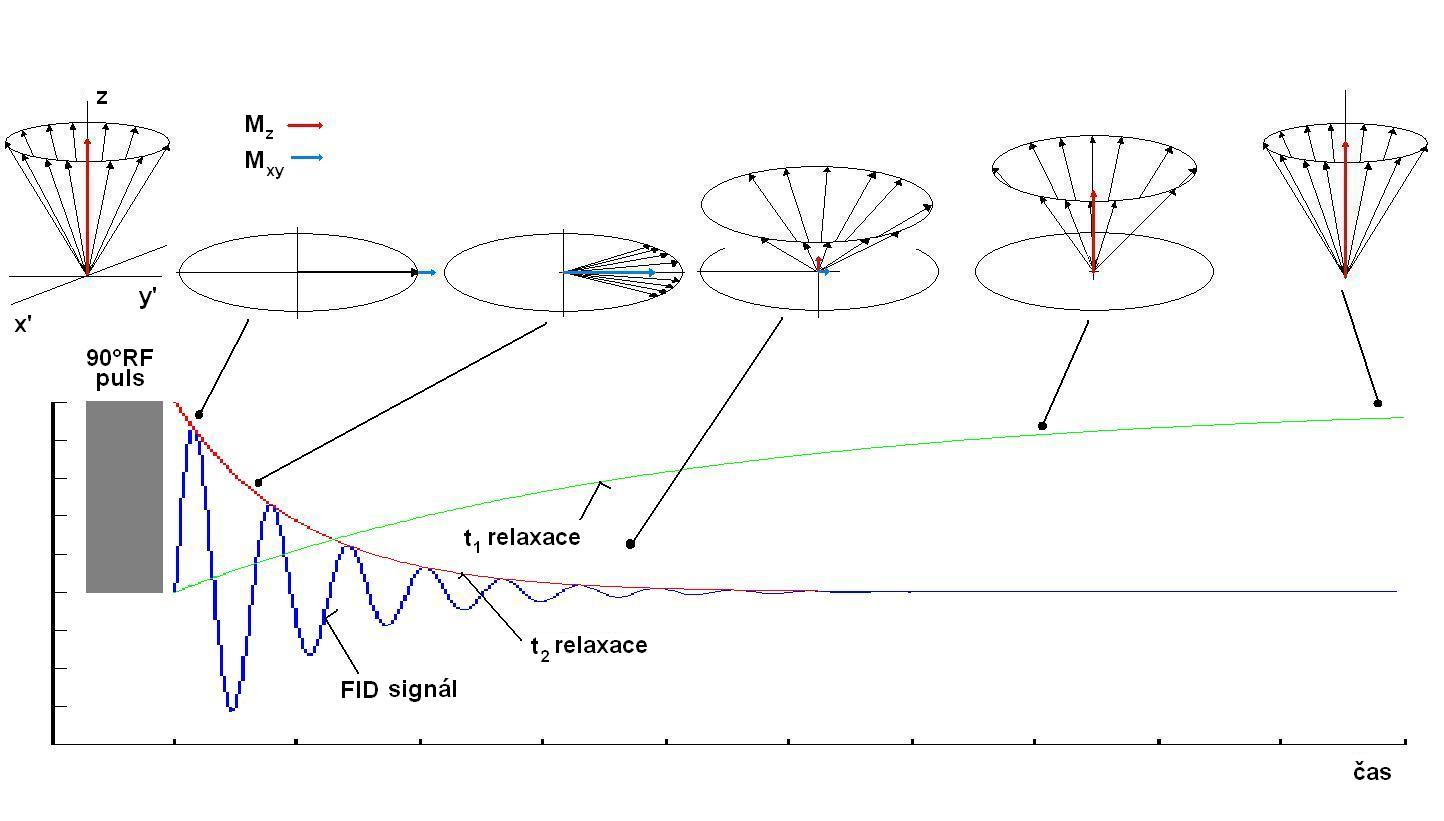
After supplying energy with a 90 ° RF pulse (vector M tilts by exactly 90 °), the tissue magnetization vector M rotates in the XY plane with the Larmor frequency w0. If we place the receiving coil in the XY plane, a voltage will be induced in it. The signal thus obtained is called FID (free induction decay) and has the shape of a harmonic waveform with exponentially decreasing amplitude.
If the electromagnetic impulse stops acting on the tissue, the so-called relaxation occurs. In the tissue area, there is a return from the excited to the original equilibrium state. The resulting tissue magnetization vector regains its size in the z-axis direction (longitudinal, spin-lattice relaxation). The course of the increase in time has the character of an exponential and can be represented by the so-called T1 curve, where the constant T1 indicates the time in which the size of Mz is restored to 63% of its original size.

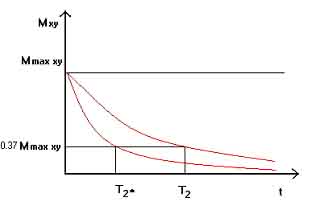
The sync effect of the electromagnetic pulse also stops working. Due to the magnetic fields of individual particles, which cause small local inhomogeneities in the magnetic field, the individual protons will precede with slightly different frequencies and there will be a gradual loss of phase uniformity of the preceded protons (spin-spin relaxation) and thus also the extinction of the transverse component of the tissue magnetization vector Mxy. The change in size over time is described by a T2 curve, which also has an exponential character. The T2 relaxation constant then indicates the time taken for the Mxy size to decrease to 37% of its maximum.

In practice, the decrease in the transverse component of tissue magnetization is influenced by even small changes in the inhomogeneity of the external magnetic field. The decrease is thus much steeper and we refer to the corresponding relaxation constant as T2 *. While this phenomenon is usually undesirable in classical MR imaging and we try to suppress it, it finds its use especially in BOLD fMRI (see the chapter on the BOLD effect).
The figure shows the distribution of magnetic moment vectors at several time points after excitation by a 90 ° RF pulse. Immediately after the RF pulse subsides, all sub-vectors are in phase and the resulting magnetization vector is inclined to the XY plane. Outwardly, we observe a magnetization vector that rotates in the XY plane. An FID signal starts to be induced in the receiving coil. Since T2 <T1 is always applied, T2 relaxation is applied faster and the amplitude of the FID signal decreases exponentially with the constant T2 (resp. T2 *). At the same time, but more slowly, T1 relaxation also occurs, which causes an increase in magnetization in the z-axis direction. The whole system converges to the equilibrium state that lasted before excitation.

To obtain images of tissues that differ in their relaxation times or proton density, so-called sequences are used (sequence of electromagnetic pulses and subsequent measurements of the electromagnetic signal emitted by the relaxing tissue).


